Overview
When it comes to digital marketing it’s important to track and analyse everything that your customers do and how they interact with your website and ads. Before now, the best way to track user activity was through Google Analytics however as many people are starting to realise, there is some data that Google Analytics just can’t track, and this can skew results. That’s where Facebook Analytics comes in.
As one of the world’s most influential social media platforms, Facebook has become a central hub for businesses to connect with their audience, build communities, and drive growth. But the true potential of Facebook lies not only in its vast user base but also in the wealth of data it offers through its robust analytics platform.
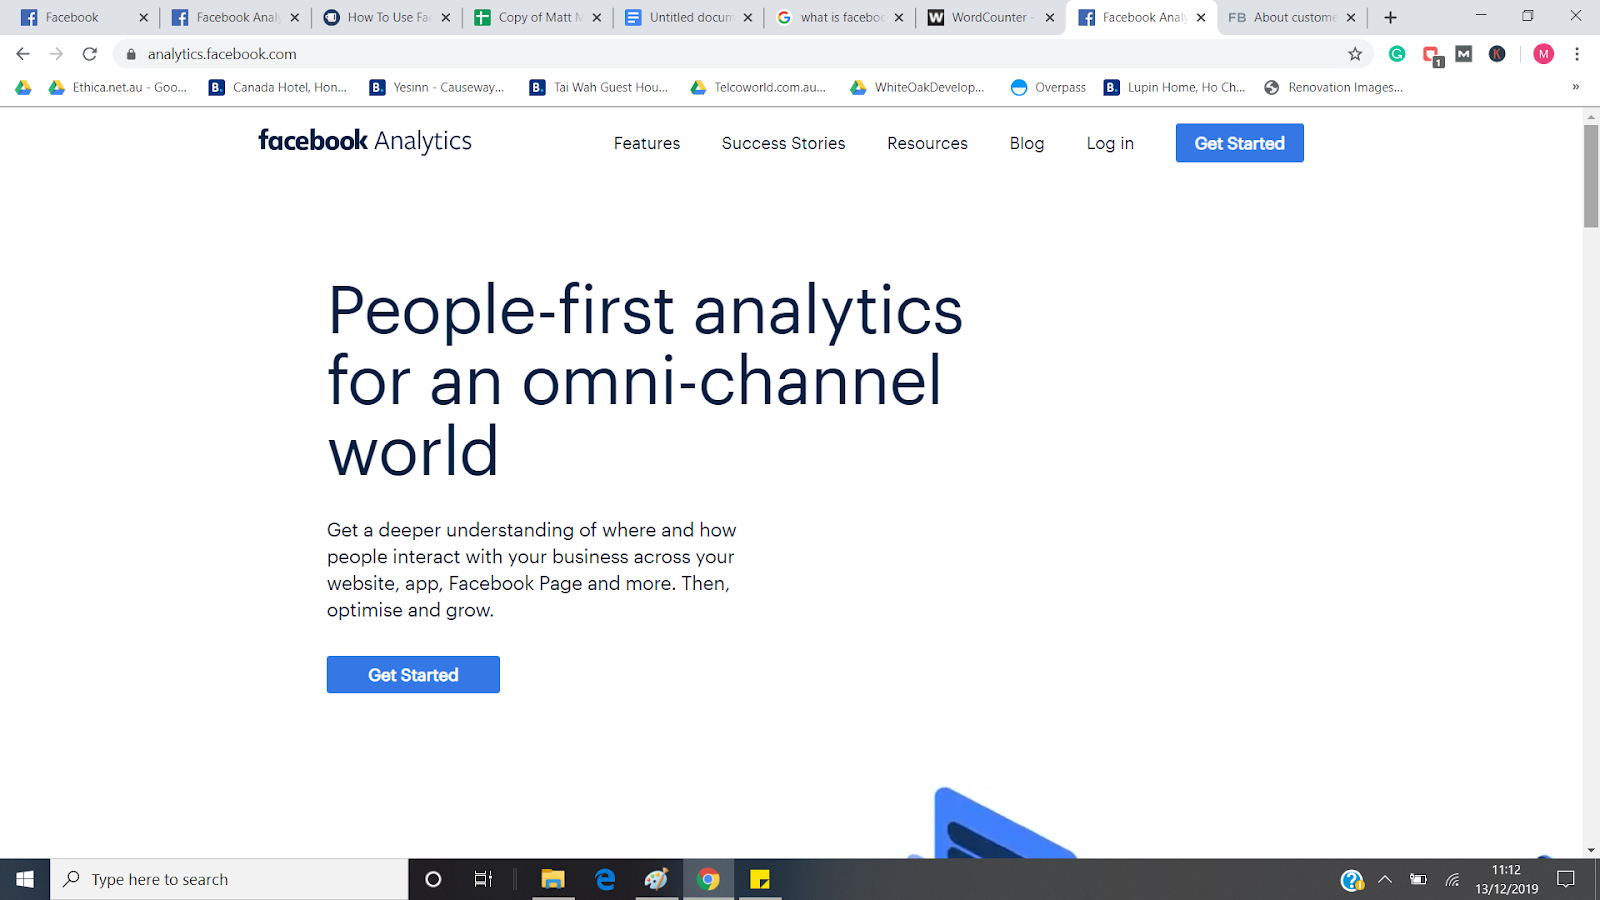
In the words of Facebook, it’s new analytics tool is “people-first analytics for an omnichannel world” and should make it easier to track their customer’s activity more accurately. In this article, we’ll be giving a brief introduction to Facebook Analytics and how you can use it to improve your business.
Join us as we explore the foundations of Facebook Analytics, learn how to leverage its capabilities to make data-backed decisions, and discover the actionable steps you can take to optimize your Facebook presence. Let’s dive into this world of data-driven marketing and unlock the true power of Facebook Analytics!
What is Facebook Analytics?
Facebook Analytics is an extremely detailed and advanced way of tracking your customer’s journey. It can help you to work out what ads your customers interact with and what platforms and channels they used to direct them to their purchase.
What’s interesting about Facebook Analytics is the way in which it tracks people. Instead of using cookies like Google Analytics, Facebook Analytics uses data from people’s interaction on Facebook platforms such as the Facebook app, Messenger and any websites that you own that have a Facebook Pixel.
This means that Facebook can map out a path to see where your customers started their journey, and these journeys aren’t always a simple as an impression or a click.
Some people will use multiple devices to research a product before finally heading to the website and buying it. They might click on Facebook as on their phone, check out your website on their tablet, and then finally head over to your site to make a purchase whilst using their laptop.
Unlike Google Analytics which only tracks impressions and conversion for Google ad, Facebook Analytics provides more in-depth data that can help you to make decision about your future marketing campaigns.
Now, all this sounds a little complicated, so you’re probably wondering – How do you actually use it? Well, there are 3 main tools with Facebook Analytics that you will want to take a look at. These are
How To Use Facebook Analytics
Now, all this sounds a little complicated, so you’re probably wondering – How do you actually use it? Well, there are 3 main tools with Facebook Analytics that you will want to take a look at. These are:
Funnels
The funnels tool allows you to track what your customers have been up to, and it can help you to spot clear correlations between Facebook interactions and sales. You can choose from a bunch of different variables and see how what your customers did on Facebook converted to sales.
For example, you could create a funnel that shows how people who commented on your Facebook ad behaved after commenting. It would show you a 3 stage funnel of people who commented, people who moved on to your website and people who ultimately made a purchase. Since Facebook ads became an option, it’s been quite difficult for business owners to accurately track the conversion rates of their ads, but the funnels tool makes things a lot easier.
Revenue Report
The next useful tool for business owners is the revenue report. You can use the Revenue report to track the number and amount of purchases. However, what’s cool about Facebook Analytics revenue report is that you can also break it down based on Age and Gender, which is a pretty useful way of learning more about your target demographic.
Customer Lifetime Value Report
The customer lifetime value report is a unique way to make estimations about the potential value of that customer’s relationship with your business.
“By using data about the customer’s purchase history, you can compile predictions about how much money they will spend over the lifetime of your relationship.”
Michael Jenkins
This data can help you to estimate sales and decide how much to spend on future marketing campaigns.
How to Set Up Facebook Analytics
Setting up Facebook Analytics is quite easy, but it’s important to ensure that you link all your channels in order to get the best results. Below is a brief rundown of how to get started using Facebook Analytics
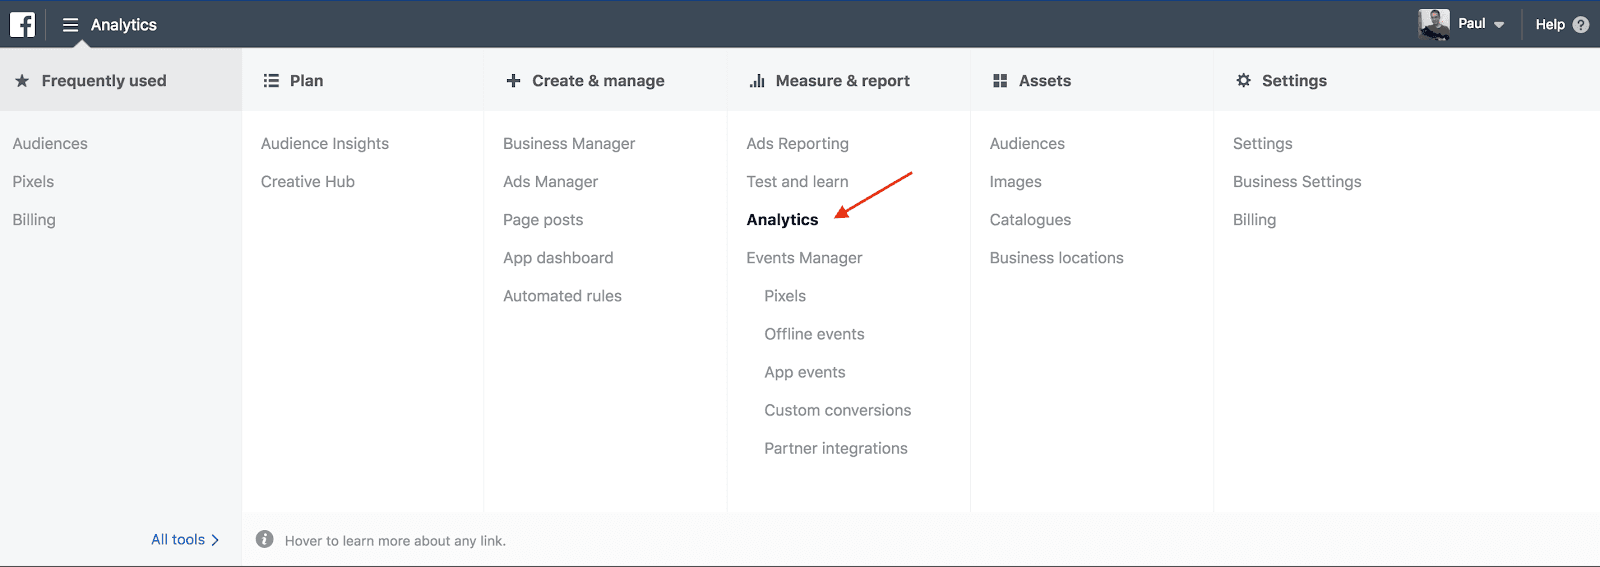
Step One: Go to the business manager and select Analytics
Step Two: Create an event source group
Step Three: Add any apps, pages, and pixels that you would like Facebook to gather the data from.
After that, you should be good to go and you can start delving into the data and optimizing your Facebook ad campaigns. If you need further assistance, contact our Facebook advertising agency in Melbourne today.


